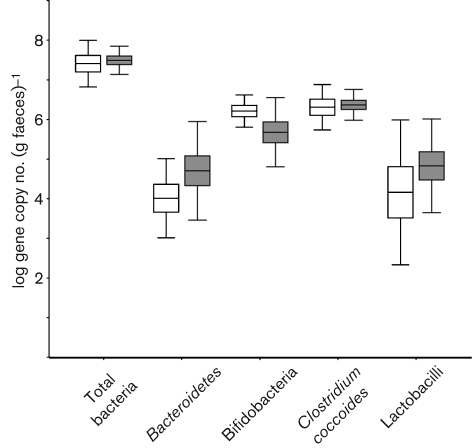
Fig. 3.
Box and whisker plot showing the quantitative estimation of universal bacteria and group-specific bacteria determined by qPCR. IBS samples were compared with nIBS samples and the values were expressed as the mean log 16S rRNA gene copy number (g faeces)−1. The plot displays the following: mean (line inside the box; its position away from the centre represents the degree of skewness in the data), sem (±1 times large box) and sd (‘whiskers’ extending from the upper and lower edges). White bars, nIBS; grey bars, IBS.

