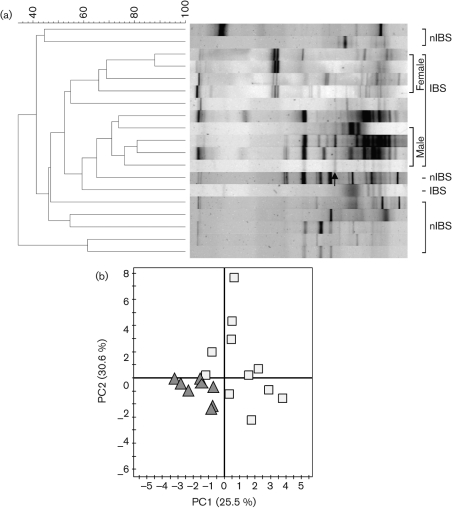
Fig. 4.
(a) Dendrogram showing the DGGE profiles of the IBS and nIBS faecal bacterial communities. Community DNA was detected by PCR amplification with universal bacterial 16S rRNA gene (V3–V5 regions) primers followed by DGGE. The dendrogram was constructed using Dsc and the UPGMA algorithm. The arrow indicates the eluted band of Eubacterium biforme. (b) PCA of DGGE fingerprints of the 16S rRNA gene of dominant bacteria in IBS (□) and nIBS (▴) samples.

