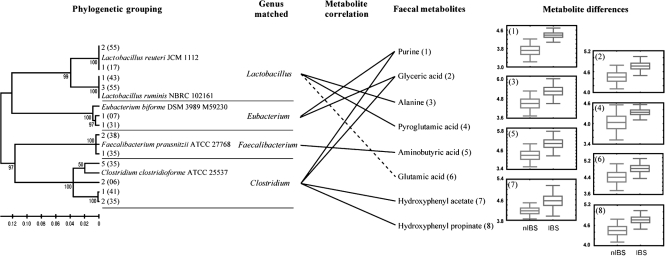
Fig. 6.
Hypothetical diagram showed a comparison of the faecal metabolites found and the major gut microbiota. The relative changes in IBS and nIBS faecal metabolites were derived from the GC-MS peak area and expressed as box and whisker plots. Positive and negative correlations are indicated as solid and dashed lines, respectively.

