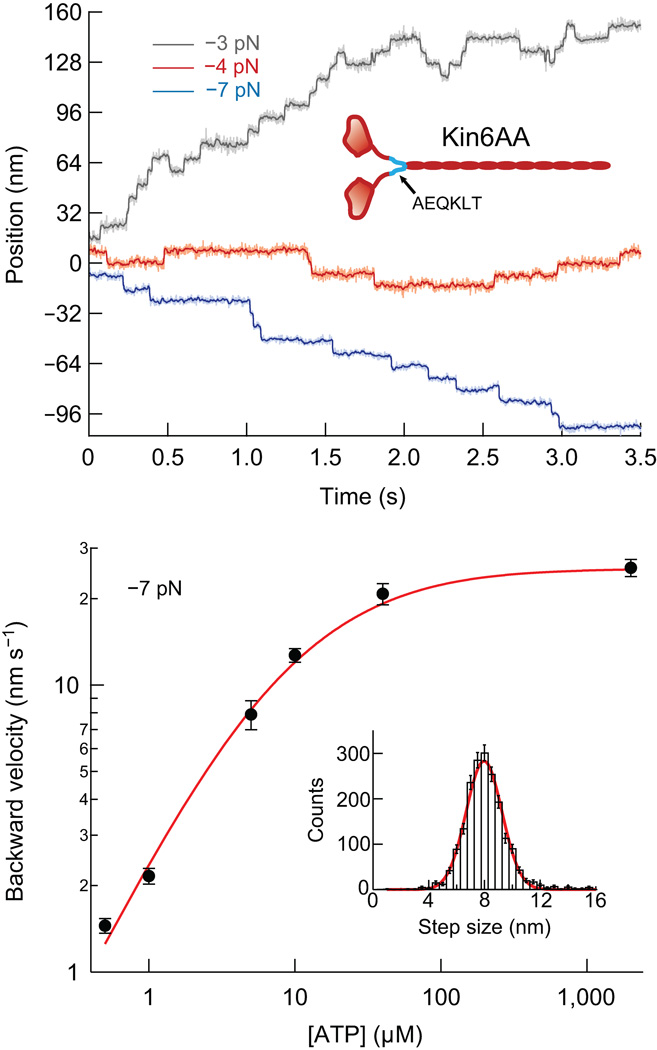
Figure 1.
Single-molecule records and backstepping velocity for Kin6AA. (a) Representative traces obtained under constant force at loads of −3 pN (gray), −4 pN (red), and −7 pN (blue), at 2 mM ATP. Light traces are unfiltered, darker traces are median-filtered. The records show clear 8-nm forward and backward steps. (b) Double-log plot of backstepping velocity vs. ATP concentration under −7-pN load (black dots; mean ± s.e.m.; N = 21−62). The solid line (red) shows the global fit to all single-molecule data for the model described in the text. Inset, histogram of the backward step size at a −7-pN load for all ATP concentrations (8.12 ± 1.72 nm, mean ± s.d., N = 1,906) and Gaussian fit (red line), centered at 7.97 nm.

