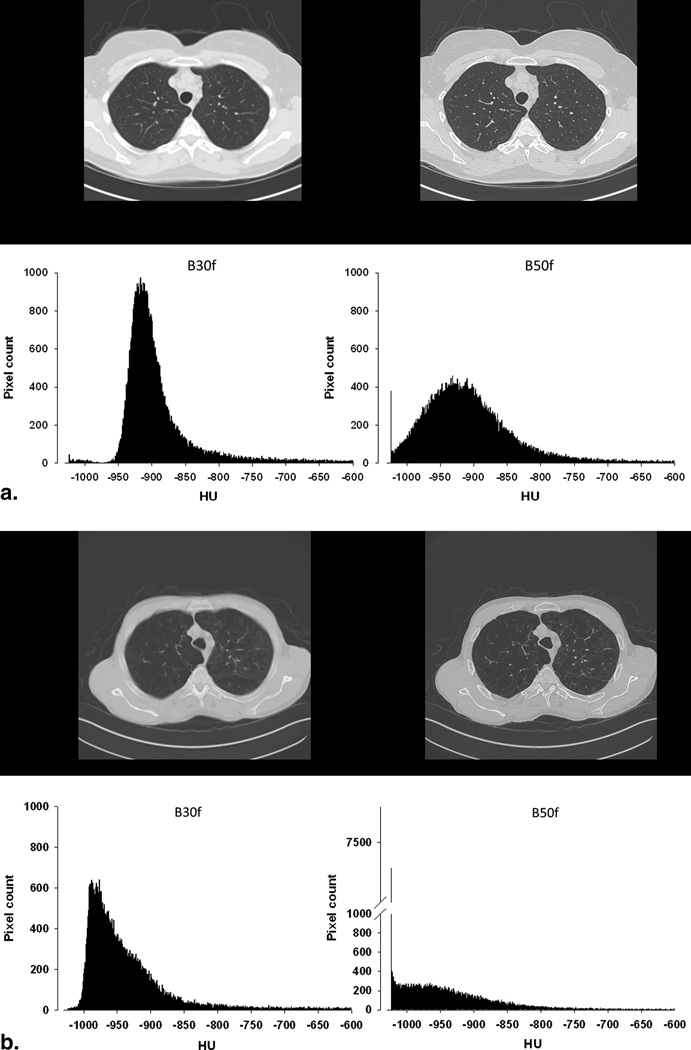
Figure 2.
a. Histograms of HU values occurrence at Total Lung Capacity (TLC) from one selected slice of a healthy subject reconstructed with a smooth filter (B30f) and thick slice thickness (left panel) and with a sharp filter (B50f) and thin slice thickness (right panel).
b. Histograms of HU values occurrence at Total Lung Capacity (TLC) from one selected slice of a patient with emphysema reconstructed with a smooth filter (B30f) and thick slice thickness (left panel) and with a sharp filter (B50f) and thin slice thickness (right panel). In the emphysema patient histogram of the image reconstructed with the sharp filter, a spike at HU=−1024 is present.

