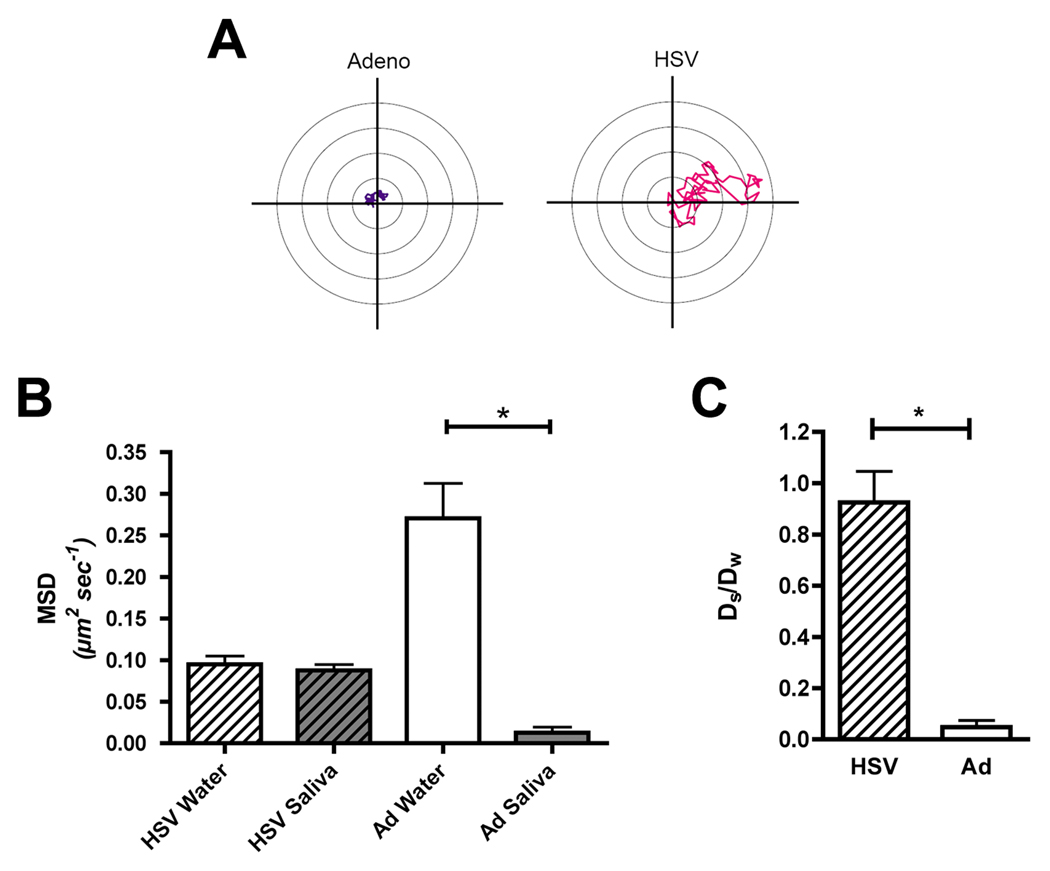
Figure 1. Adenovirus particles, but not HSV-1 virions, are trapped in saliva.
Fluorescent adenovirus or HSV-1 virions were suspended in either water or saliva, and then loaded into custom-made microfluidic chambers. Virus trajectories were obtained with a 100X oil immersion objective (total magnification of 1,000X) at an imaging speed of 13.44 fps for a duration of 15 seconds. Mean squared displacements (MSD) as a function of time were calculated from trajectories to determine the mobility of individual viral particles and averaged for each viral population (average of 70 particles per condition). (A) Representative trajectories of adenovirus and HSV in saliva. (B) Mobility of HSV and adenovirus in water and saliva. Data represent mean values ± the standard error of the mean (SEM). *: Denotes a statistically significant difference in the MSD value for adenovirus in water, versus saliva (p=0.0028, Mann Whitney test). (C) Ratios of the diffusion coefficients of the viruses in saliva (DS), compared to water (Dw). Data represent mean values ± standard deviation (SD). *: Denotes a statistically significant difference in the Ds/Dw value for adenovirus versus HSV (p<0.0001, unpaired t test).

