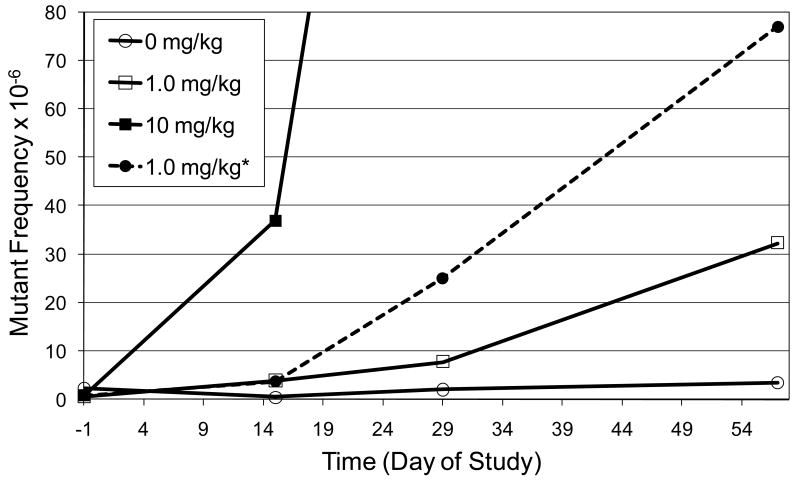
Figure 8.
Comparison of observed and expected mutant RBC (CD59 negative) frequencies in the peripheral blood of rats treated with 1.0 mg/kg ENU for 28 days.
*Line represents expected mutant frequency for 28 daily doses of 1 mg/kg given for 28 days, which would expected to be 10 fold lower than the frequency induced by 10 mg/kg, assuming a strict linear relationship between dose and the induction of mutants.

