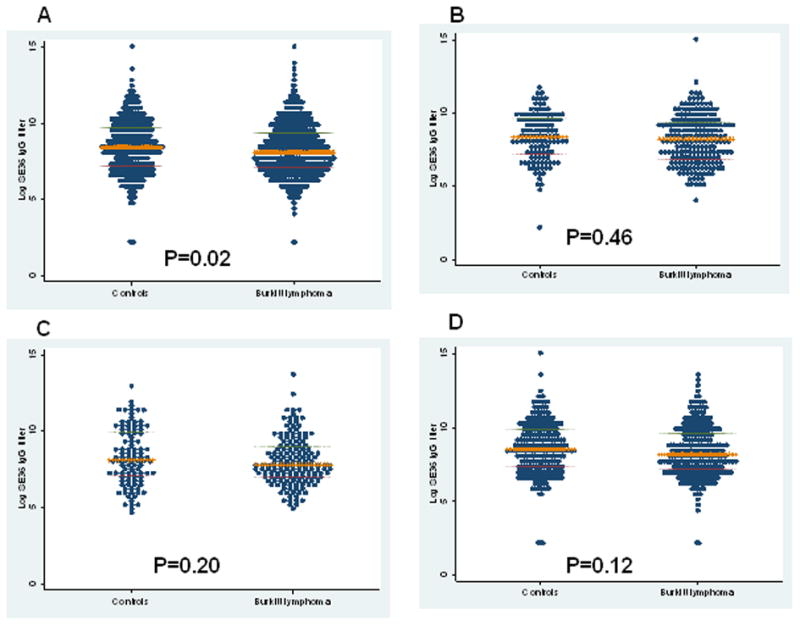
Figure 2.

Dot plot of log (base 2) anti-SE36 IgG antibody titers for all cases and controls (panel A) and for cases and controls during 1965–1974 (Panel B), 1975–1984 (Panel C) and 1985–1994 (Panel D). Each dot represents a single subject, the horizontal bar in the middle is the median and the outer bars represent the 25th and 75th inter-quartile ranges.
