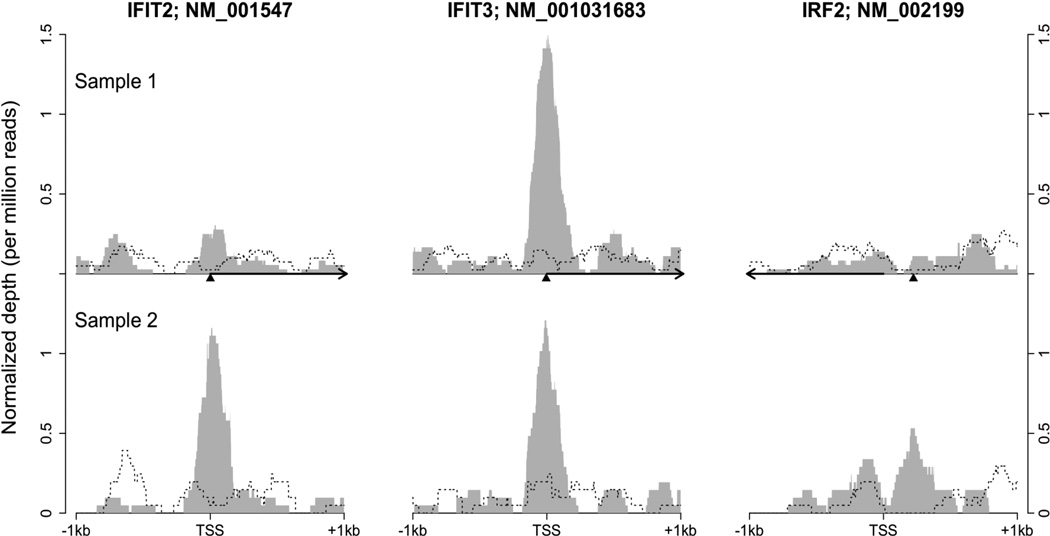
Figure 4. The depth of ChIP-seq signal at three locations of IRF1 binding.
The height represents normalized coverage depth out of one million reads in each sample. The upper half of the figure was based on the original pair of IRF1 ChIP-seq (grey shadow) and DNA input ChIP-seq (dashed line) samples. The lower half was based on the validating pair. Depth information was plotted around the TSS of three IRF1 target genes. Arrows indicate the direction of transcription and the triangles point to the locations of the last base of IRF1 binding motif. NM_001031683 is one of two alternative transcripts of IFIT3.

