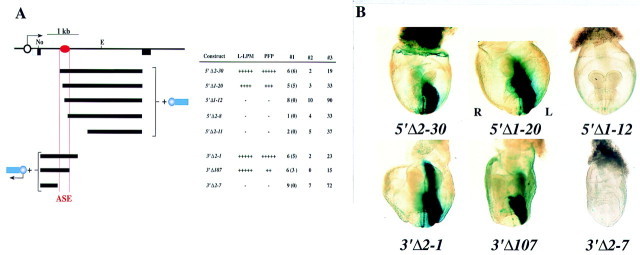
Figure 5.
Mapping of ASE to a 340-bp region of intron 1. (A) Structures and activities of various deletion mutants of 3′-1hsp. The approximate location of ASE is shown by the red oval. (B) X-gal staining in representative embryos. Constructs 5′Δ2–30, 5′Δ1–20, 3′Δ2–1, and 3′Δ107 induced left-sided X-gal staining in LPM and PFP, whereas 5′Δ1–12 and 3′Δ2–7 failed to give rise to X-gal staining.

