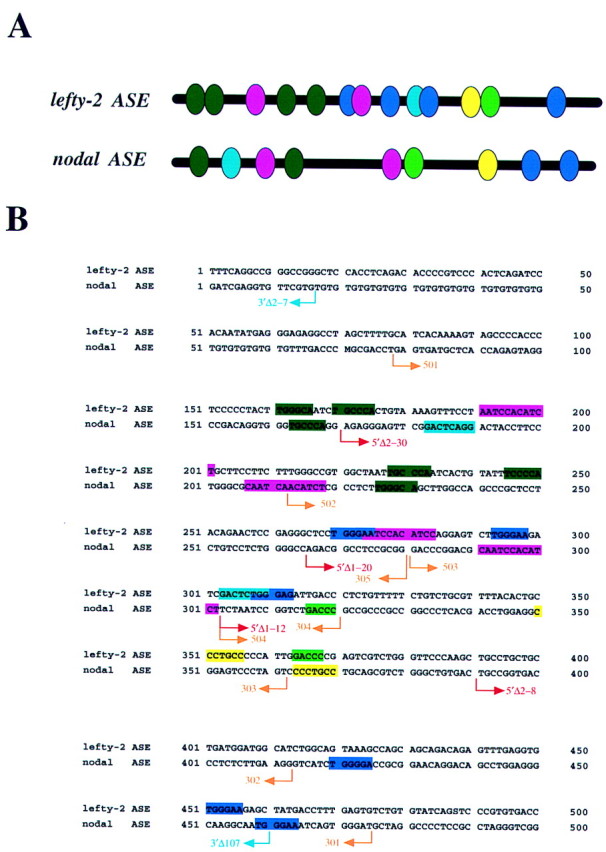
Figure 8.

Comparison of the structures of nodal ASE and lefty-2 ASE. (A) Structural organization of nodal ASE (340 bp) and lefty-2 ASE (350 bp). Conserved sequence motifs are indicated by ovals of various colors. (B) Nucleotide sequences of nodal ASE and lefty-2 ASE. The positions of nodal deletion mutants shown in Figs. 5 and 9 are indicated by arrows.
