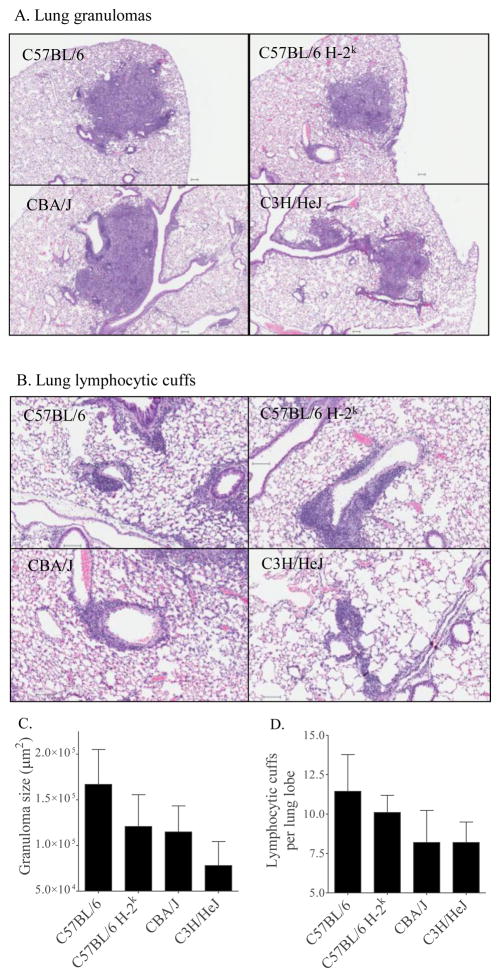
Figure 4. Immune cell aggregates in lungs of M.tb infected mice.
Mice were infected with 37 ± 32 CFU of M.tb Erdman by aerosol and euthanized at day 21 of infection. Lung lobes from individual mice were fixed in neutral buffered formalin, embedded in paraffin, sectioned, and stained with hematoxylin and eosin. Slides were digitally scanned. Examples of representative granulomas (A) and lymphocytic cuffs (B) are shown for each mouse strain. Granuloma size (C) and the number of lymphocytic cuffs (D) were quantified. Results are the average and SEM of two independent experiments, each with five mice per group: total group size per strain: n=10. Statistical calculations by the Student’s t-test (C57BL/5 vs C57BL/6 H-2k) and one-way ANOVA with Tukey’s post test (C57BL/6 H-2k, CBA/J, C3H/HeJ) did not identify significant (p<0.05) differences.

