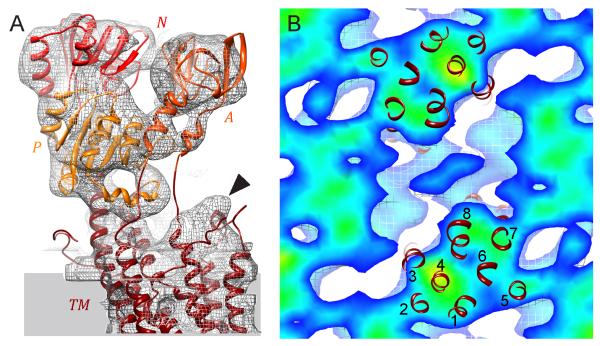
Figure 5.
Fitting an atomic model to the map from DMPC/DOPE tubes. (A) Domains are shown in various shades of red and are labeled accordingly. Isolated density for individual α-helices are visible in A- and P-domains and other α-helices at the periphery of N- and P-domains fit snugly within the isosurface density envelope. The envelope for the transmembrane domain (TM) shows a distinct bulge at top right, consistent with the kinked cytoplasmic end of M1. (B) Section through the transmembrane region of the density map overlaid with transmembrane helices, which are numbered. This is a view from the extracellular side of the membrane. See also Movie S1.

