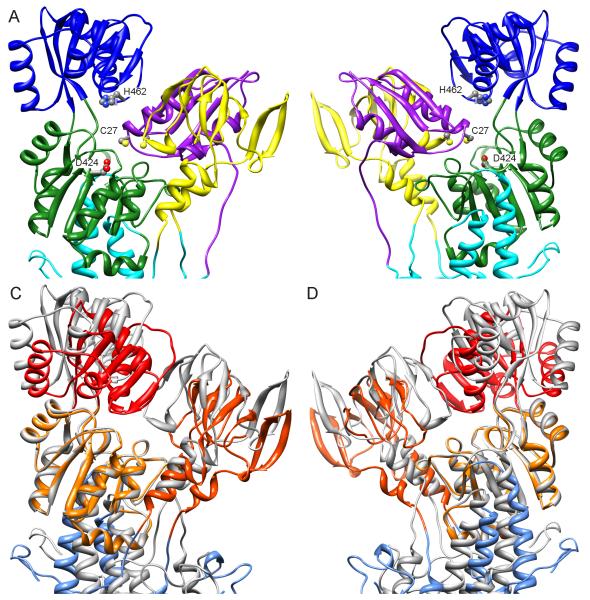
Figure 7.
Docking of the NMBD to an all-atom model for ΔC-CopA. (A-B) Two views of the result obtained by the computational docking rotated at 180° about a vertical axis. The NMBD is colored purple, A-domain yellow, N-domain blue, P-domain green and transmembrane helices cyan. Key residues shown are C27 from the GMTCAMC30 Cu-binding loop of the NMBD, H462 from the ERRSEHP463 ATP-binding loop in the N-domain, and the catalytic D424 from the DKTGTLTT431 phosphorylation loop in the P-domain. (C-D) Equivalent views of an overlay between the homology model used for docking (same as in A and B but colored grey and lacking the NMBD) and the atomic model fitted to the density map from DMPC/DOPE tubes (colored shades of red). The P-domains are aligned, revealing relative movements of the N- and A-domains as well as a different angle of the transmembrane domain. See also Figure S3.

