
Fig. 12. The Ih of GAERS TC cells has a diminished sensitivity to submaximal, near-physiological cAMP pulses, but not to saturating concentrations of cAMP.
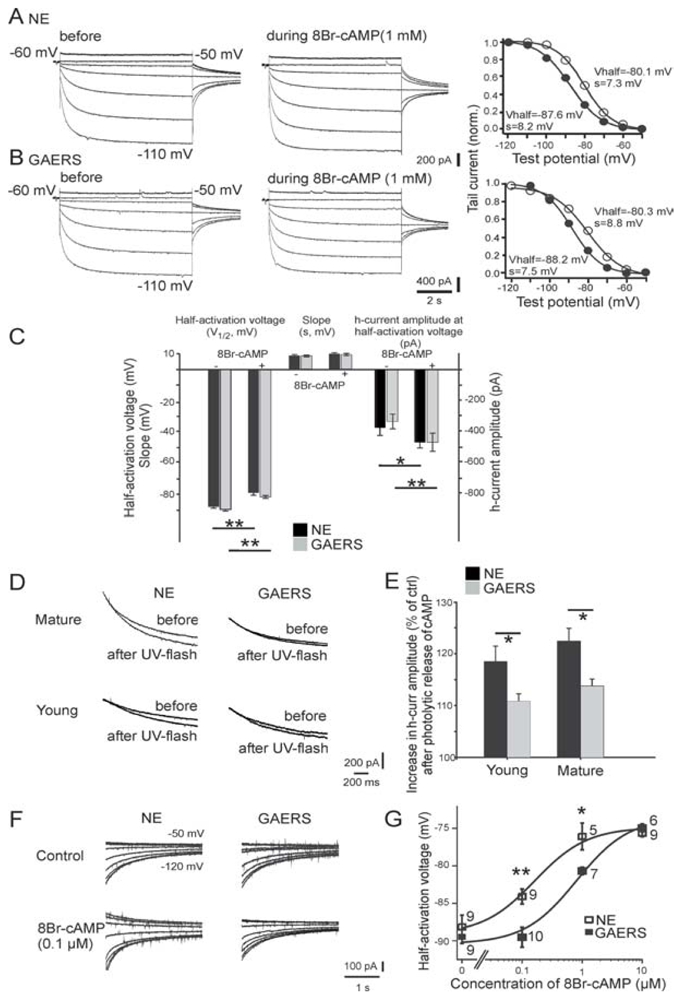
(A,B) Current responses of mature TC cells from a non-epileptic control (NEC) rat (A) and a GAERS (B) to increasing negative test voltages (test voltages −50mV and −110mV are indicated next to the traces) before, and in the continuous presence of, 1mM 8Br-cAMP. Corresponding activation curves, constructed from tail currents evoked at −80mV (see Methods), are shown to the right. Thick lines represent the optimal fit of a Boltzmann curve, with the resulting values for the half-activation voltage (Vhalf) and the slope (s) indicated next to them. Filled and open circles represent values before and during 8Br-cAMP application, respectively. (C) Pooled data for V1/2, for s, and for the current amplitude at −90mV before, and in the continuous presence of 8Br-cAMP (1mM). Except for s, 8Br-cAMP significantly altered all control values. The changes in all three parameters were indistinguishable between mature NEC rat (n = 8) and GAERS (n = 7) TC cells. (D) Responses of Ih to photolytic release of caged cAMP in mature (top row) and young (bottom row) NEC animals and GAERS. Overlay of current responses to 30mV hyperpolarizing voltage steps before and after application of a UV flash in cells perfused with caged cAMP. Holding potential was − 60mV. For clarity, only current relaxations during the hyperpolarizing voltage step are shown; passive responses to the step voltage were blanked. (E) The percentage increase in current response in young and mature NEC animals (young, n = 12; mature, n = 8) and GAERS (young, n = 12; mature, n = 12). (F) Representative tail currents obtained from TC cells in the absence of (control) or during perfusion of the cellular interior with 0.1mM 8Br-cAMP. The same voltage protocol as in A was used, voltage steps applied prior to evoking tail currents are indicated next to the traces, and tails were evoked at −75mV. (G) Concentration-response curve for the effect of 8Br-cAMP on the half-activation voltage. The number of recorded cells is indicated next to the symbols. Fitting of the Hill equation was achieved by fixing the Hill coefficient to 1 (see Methods in Kuisle, 2006), yielding a ~5-fold increase of half maximal concentration of 8Br-cAMP in GAERS. *P < 0.05, ** P <0.01. From (Kuisle et al., 2006).