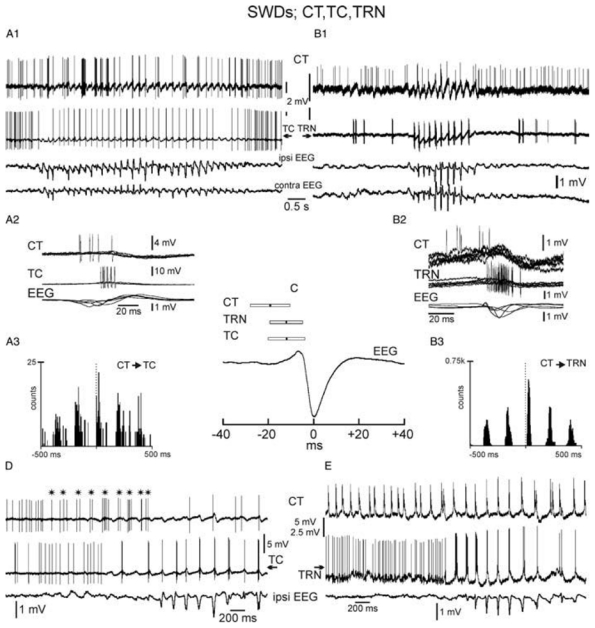
Fig. 8. Dual extracellular recordings of a CT neuron with either a TC (A1–A3,D) or a TRN (B1–B3,E) cell during spontaneous SWDs.

(A2,B2) Five superimposed, successive, recordings of SW-related action potential discharges. (A3,B3) Cross-correlograms (2 msec resolution) computed from pair recordings. (C) Means and S.D. of the time relationship between the CT, TC and TRN action potential discharges and the SW complex (CT: −19.4 ± 8.8 msec, 88 SW complexes from four rats: TRN: −11.9 ± 7.3 msec, 108 SW complexes from six rats: TC: −12.6 ± 8.2 msec, 133 SW complexes, seven rats. (D) * indicates the beginning of the CT rhythmic discharge, which starts before both the TC rhythmic firing and the occurrence of the seizure. (E) The CT cell discharges in a rhythmic manner well before the related TRN neuron and before the beginning of the SWD.
