
Fig. 9. Intracellular activities of TC (A,C) and TRN (B,D) neurons during spontaneously occurring SWDs in GAERS.
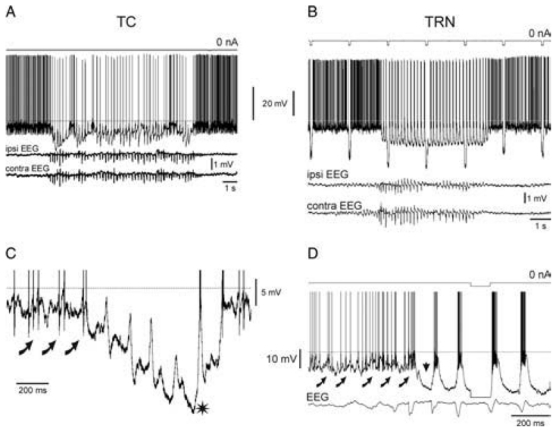
The traces in A and B are expanded in C and D, respectively, to show the first intracellular events that are associated with the ‘onset’ of SWDs. Curved arrows indicate rhythmic barrages of EPSPs, which occur just before the beginning of spontaneously occurring SWDs. The horizontal dotted line indicates the action potential threshold (− 58mV) at rest. The action potentials are clipped in C and D. Adapted from (Pinault, 2003).