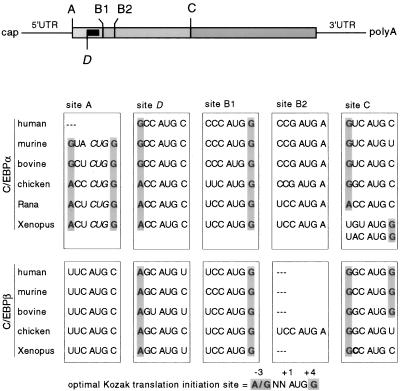
Figure 1.
Representation of the vertebrate C/EBPα and C/EBPβ mRNA structure and comparison of the potential translation initiation sites. (Top) Shaded areas indicate the C/EBP coding region. The potential translation initiation sites are designated A, B1, B2, and C. The solid box represents the small uORF initiated at site D, which is out of frame with respect to the C/EBP reading frame. (Below) Shading indicates critical nucleotides at position −3 and +4 corresponding to the optimal Kozak translation initiation consensus sequence (bottom).

