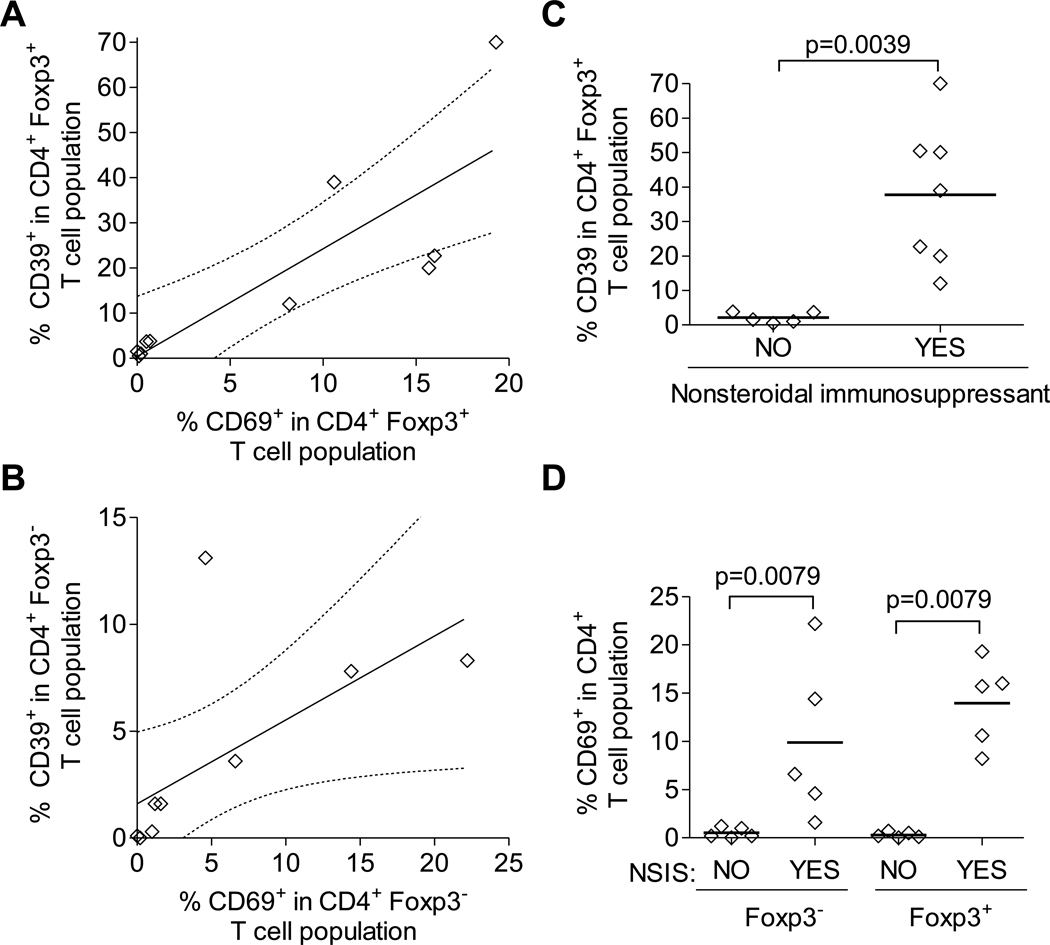
Fig. 4. Association of CD39 expression with T cell activation and medication usage.
Correlation of proportion of CD39+ cells with CD69+ cells in (A) CD4+ Foxp3+ Treg populations and (B) CD4+ Foxp3− non-Treg populations among SLE patients (active and minimally active disease). Expression of CD39 (C) and CD69 (D) in Foxp3+ Tregs (C,D) and Foxp3− non-Tregs from SLE patients (active and minimally active disease), stratified by usage of nonsteroidal immunosuppressants (NSIS).

