Figure 1.
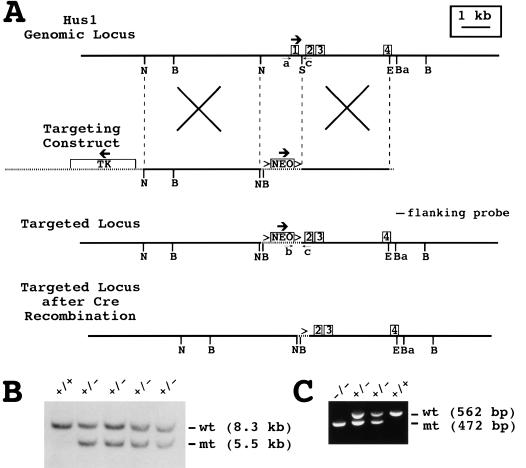
Targeted disruption of the mouse Hus1 gene. (A) Restriction maps of the Hus1 genomic locus, targeting construct, targeted locus, and targeted locus following cre-mediated recombination. The first four Hus1 exons are shown as boxes. Vector-derived sequences are shown as stippled lines, and thick arrows indicate the direction of transcription for the Hus1, neomycin resistance (Neo), and thymidine kinase (Tk) genes. LoxP sites are represented by the (>) symbols. The positions of the flanking probe and PCR primers a, b, and c used for genotyping are indicated. Homologous recombination of the targeting construct is depicted by the large Xs. (B) BglI, (Ba) BamHI, (E) EcoRV, (N) NheI, (S) SmaI. (B) Southern blot analysis of ES cell genomic DNA. Genomic DNA from wild-type TC-1 cells (+/+) or four independent targeted ES cell clones (+/−) was digested with BglI and hybridized with the flanking probe. The positions of the bands corresponding to the wild-type (wt) and targeted mutant (mt) Hus1 alleles are indicated. (C) Representative PCR analysis of yolk sac genomic DNA obtained from progeny of a Hus1 heterozygote intercross using the primers shown in A. The positions of PCR products from the wild-type (wt) and targeted mutant (mt) Hus1 alleles are indicated.

