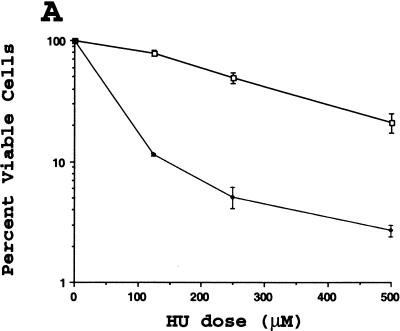
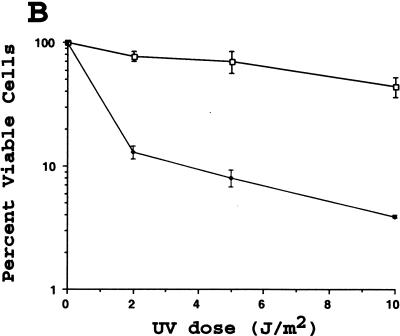
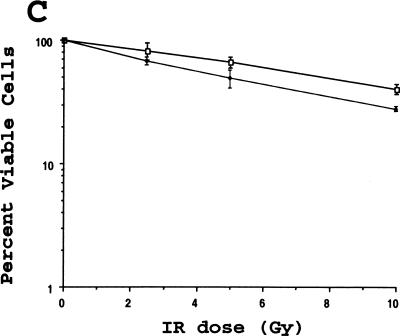
Figure 7.
Increased sensitivity of Hus1-deficient cells to certain genotoxins. Hus1+/+p21−/− (□) or Hus1−/−p21−/− (♦) MEFs were plated in 6-well culture dishes and treated with the indicated doses of (A) HU, (B) UV, or (C) IR as described in Materials and Methods. Cell viability was assessed 72 hr after treatment and is plotted as the percent viable cells relative to results for untreated control cultures. Each point represents the mean of three samples, with error bars showing standard deviation. The plots are representative of results obtained for three independent Hus1−/−p21−/− and matched control Hus1+/+p21−/− MEF cultures.


