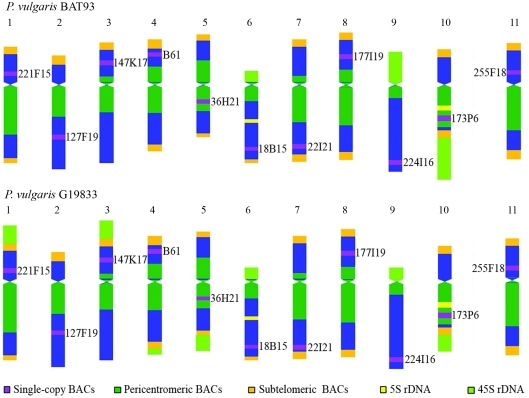
Figure 3.
Modified idiogram of BAT93 (Pedrosa-Harand et al, 2009; Fonsêca et al., 2010) and schematic representation of G19833 chromosomes, showing the distribution patterns of repetitive sequences. Approximate positions of chromosome markers are also indicated.

