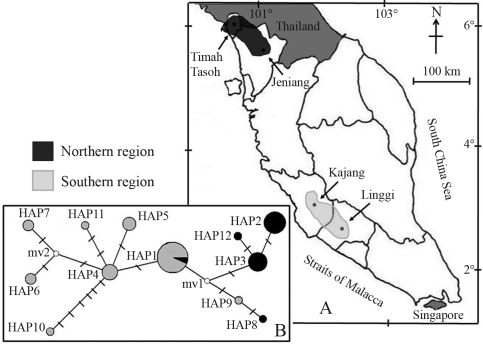
Figure 1.
A. Sampling localities of the four Channa striata populations analyzed in the study. B. The minimum spanning-network relationships among the twelve haplotypes of mtDNA CO1 in the four populations of Channa striata. Each bar with a crossed connection between haplotypes represents one mutation site. The size of each circle is an approximate indication of haplotype frequency [black circle found in northern region populations; grey circle found in southern region populations; open circle is the intermediate (mv)].

