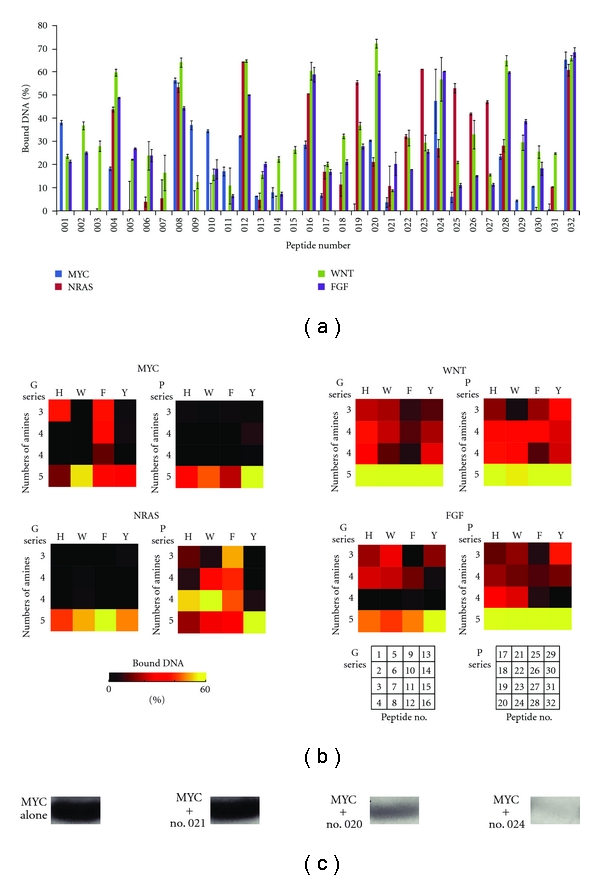
Figure 2.

(a) Bound DNA percentages to each library peptide. (b) Bound DNA percentages to each peptide shown as a color illustration. (c) Typical MYC bands in PAGE. MYC alone (A representative of 0% bound DNA percentage), MYC with no. 021 (a representative of 0–10% bound DNA percentage), MYC with no. 020 (a representative of 30–40% bound DNA percentage), and MYC with no. 024 (a representative of 50–70% bound DNA percentage).
