Fig. 1.
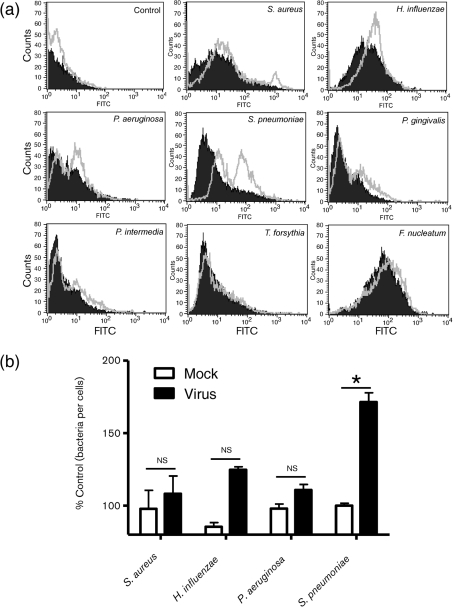
HCoV-NL63-mediated modulation of bacterial adherence to LLC-MK2 cells. (a) Bacterial adhesion was quantified by FACS. The histograms illustrate the fluorescence intensities and corresponding numbers of FITC-labelled bacteria attached to mock-treated or virus-infected cells (filled areas and grey lines, respectively). Data are representative of three independent experiments. (b) The number of adherent bacteria was quantified by plating and c.f.u. counting. Bars represent the number of bacteria that attached to mock- or HCoV-NL63-infected LLC-MK2 cells as a percentage of the control. Adhesion is expressed as a percentage of the control. The results are shown as means±sd of three independent experiments. The statistical significance of observed differences was estimated using Student’s t-test; *, P<0.01; ns, not significant.

