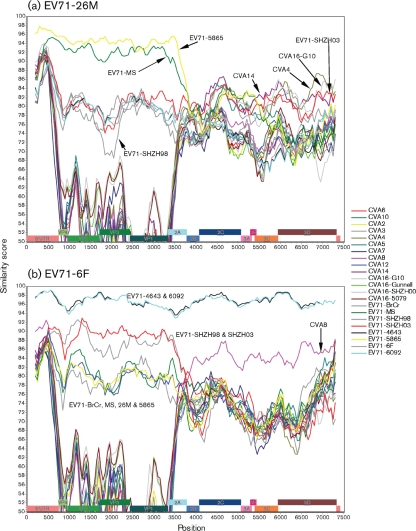
Fig. 2.
Similarity plots of HEV-A virus nucleotide sequences calculated by SimPlot 3.5.1 (Lole et al., 1999). Each point represents the similarity between the query sequence [(a) EV71-26M; (b) EV71-6F] and a given heterologous sequence, within a sliding window of 400 nt centred on the position plotted, with a step of 50 residues between points. Positions containing gaps were excluded from the analysis.

