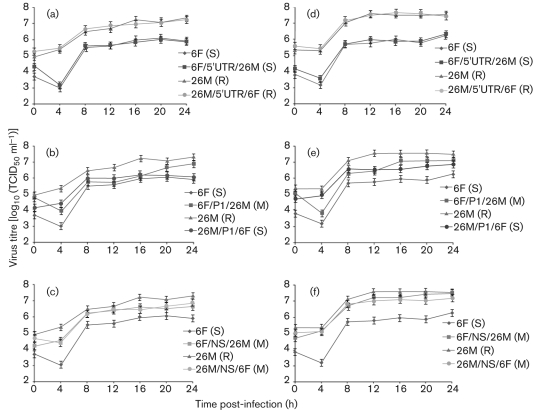
Fig. 4.
Single-step growth kinetics of parental and chimeric viruses on Vero (a–c) and RD (d–f) cells. (a, d) Growth kinetics of wild-type and 5′UTR chimera viruses. (b, e) Growth kinetics of wild-type and P1 region chimera viruses. (c, f) Growth kinetics of wild-type and non-structural protein (P2 and P3 regions) chimera viruses. Cell monolayers were infected at an m.o.i. of 5. Cell-culture supernatants were collected at the times indicated and titrated by TCID50 assay. All assays were performed in triplicate. At each time point, titres are means of three samples; error bars represent sem. The growth phenotypes of each chimeric virus are shown in parentheses (S, slow; M, medium; R, rapid).

