
Fig. 2.
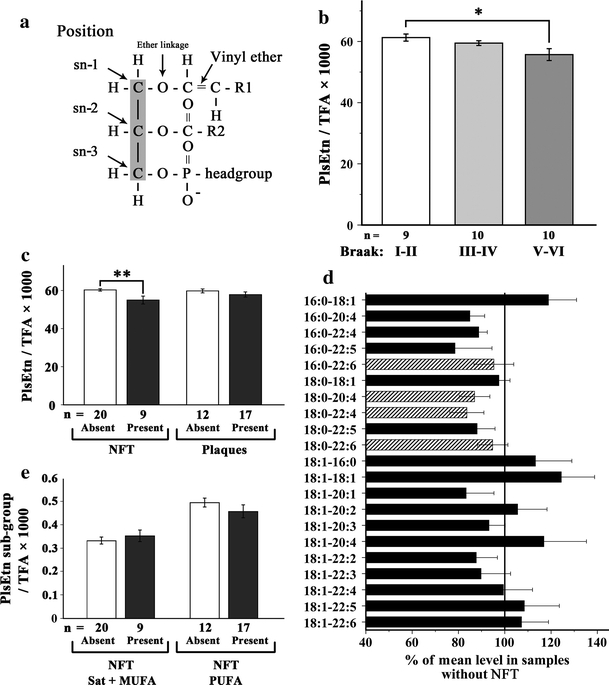
Plasmalogens are reduced in gyrus frontalis with AD pathology. a Schematic structure of plasmalogen. b, c The relative levels of total ethanolamine plasmalogens (PlsEtn) in gyrus frontalis medius were determined by GC–MS and expressed as ratio to the total fatty acid (TFA) content (×1,000). Reduced levels were observed when the samples were grouped either by Braak staging of neuropathology (b corr. p = 0.027) or by the presence or absence of NFT (c left; p = 0.004) or plaques (c right; p = 0.300). d Individual plasmalogen sub-species were determined by nano-ESI–MS and depicted as percentage of the mean level of the same plasmalogen species in samples without NFT. The four main species (striped) account together for 58.5% of total plasmalogen. e The level of plasmalogen species grouped according to the degree of saturation of the fatty acid at the sn-2 position and the presence or absence of NFT. The difference between the 6.1% increase in plasmalogens with saturated (sat) or monounsaturated (MUFA) fatty acids at sn-2 compared with the 7.7% decrease in those with polyunsaturated fatty acids (PUFA) is statistically significant (p = 0.019) The number (n) of cases in each group are indicated below the graphs. Error bars indicate SEM; *p < 0.05 and **p < 0.01; corr., corrected for multiple testing (Tukey’s post hoc test)