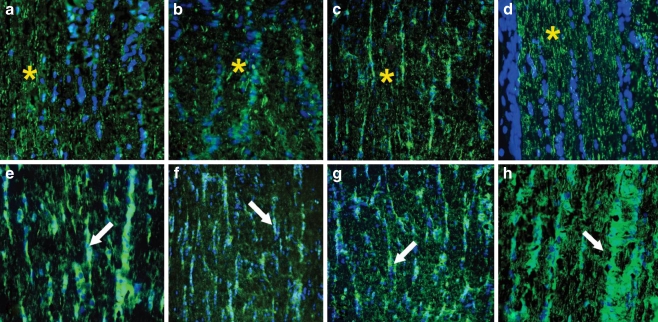
Fig. 4.
Immunolabeling patterns by patients' autoantibodies on the longitudinal sections of the rat optic nerve. Representative immunofluorescent labeling for 3(a, b, c) sera shows labeling of axons similar to that of the axonal marker RT97 (d) indicated by asterisks (top pictures). Bottom pictures show other three representative sera (e, f, g) that labeled astrocytic columns (arrows) in the optic nerve in a similar pattern to that of the astrocyte marker GFAP (h); green FITC for antibodies; blue DAPI for nuclei

