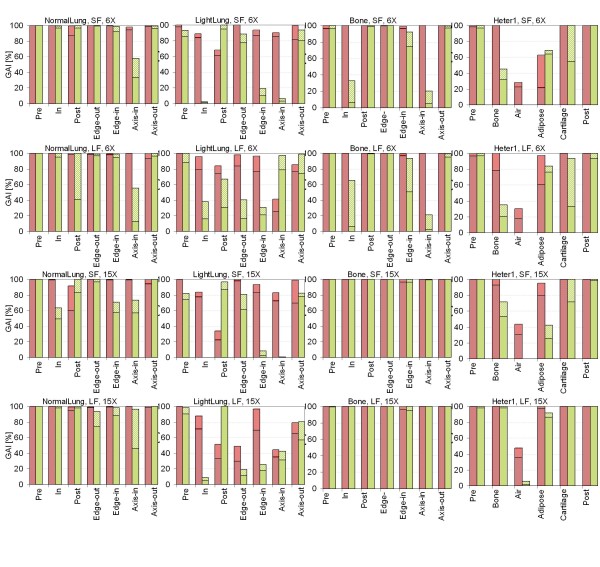
Figure 11.
Histograms of the GAI. Global gamma calculation for each sector of phantoms A and B, for dose to medium calculations for Acuros XB version 10 (red horizontal hatching) and AAA (green diagonal hatching). Each bin represents the two threshold results of 2%, 2 mm (thin cross-hatching) and 3%, 3 mm (thick cross-hatching). In columns: Normal Lung, Light Lung, Bone, phantom B; in rows: SF and LF for 6X, SF and LF for 15X.

