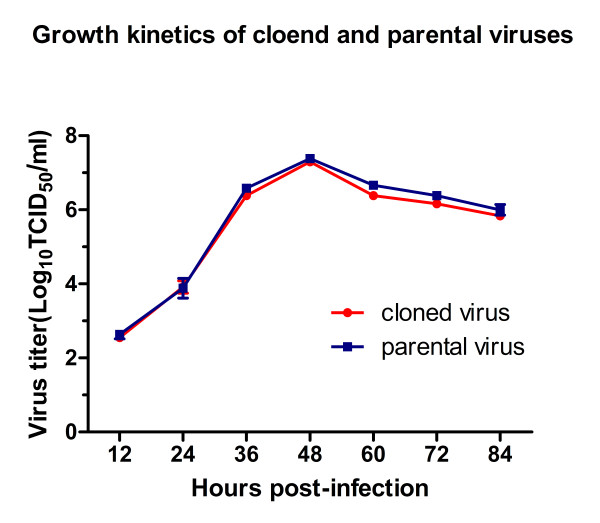
Figure 5.
Growth kinetics of cloned and parental virus. The growth curves of the rescued virus and parental virus were drawn by assaying the viral titers of the supernatants obtained from 12 h to 84 h postinfection by using microtitration infectivity assays. Data are calculated and shown as means ± standard deviations (error bars) from three independent trials.

