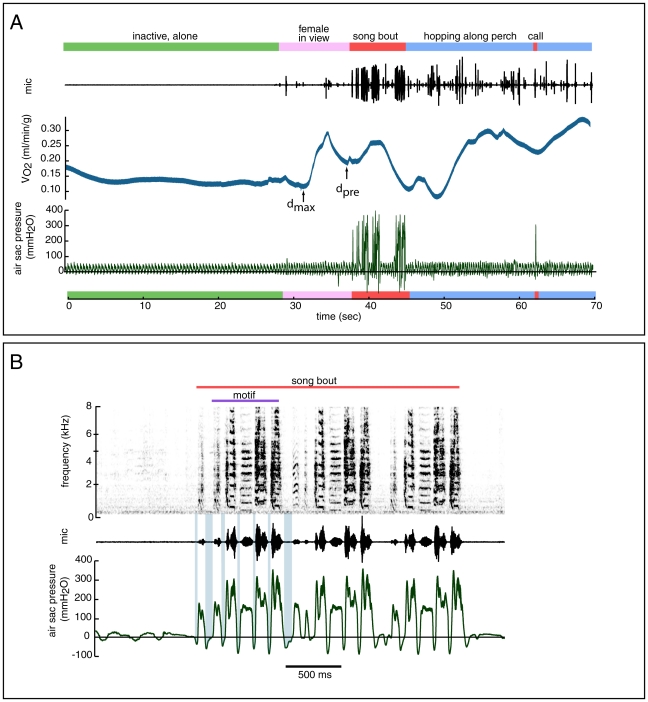
Figure 4. Rates of oxygen consumption (blue trace, panel A) varied with activity and with background noise conditions.
In this typical example (A) the bird is sitting quietly out of view of any conspecifics during the first 30 seconds. Both  and the respiration rate remain fairly constant (each cycle from positive to negative in the air sac pressure trace (bottom, green) represents an expiration and inspiration during quiet respiration). Around 30 sec, a female is moved into the visual range of the subject bird. With the presence of the female, respiration rate increases and
  increases after a short lag. Immediately before song, there is a drop in
  . Measurements of pre-Song to during-Song differences were made from the minimum point that occurred within 500 ms of the onset of song (dpre), and also from the lowest
  rate observed in the 10 second interval before the onset of song (dmax), to the peak
  during the song bout. (B) An example of the air sac pressure pattern (bottom trace, green) during a typical zebra finch song bout (spectrogram, top), in this song the motif is repeated 3times. Minibreaths (seen as periods of negative pressure between syllables, and shaded blue in the first motif for illustration purposes) did not change in depth or duration with increases in song amplitude in 4 out of 5 birds measured.

