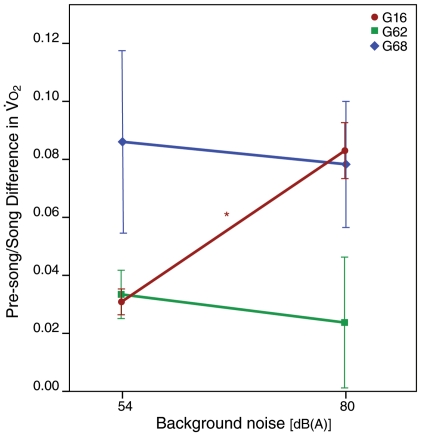
Figure 5. Differences between the mean rate of O2 consumption during song and the mean rate of O2 consumption ( ) immediately before song bouts.
In one bird (G16), song amplitude and background noise condition were significantly correlated with differences between pre-song and during-song  levels. The remaining two birds (G62 and G68) pre-song to during-song differences were not correlated with background noise treatment or song amplitude. Data points show mean difference between pre-song and during-song
  levels, error bars indicate 95% confidence intervals (* indicates significance at p<0.001 levels, see text for details).

