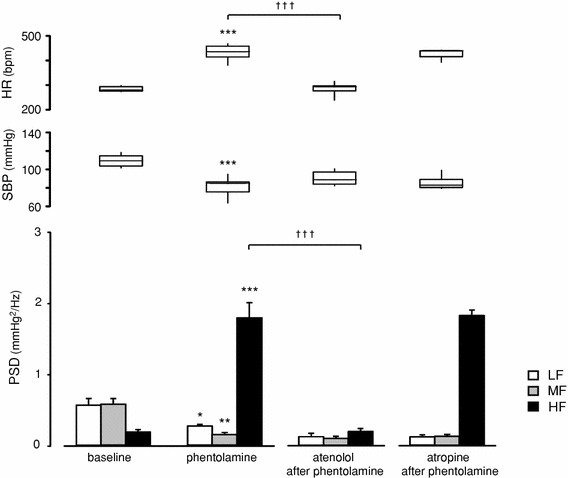
Fig. 3.

Effects of subsequent administration of atenolol or atropine after phentolamine treatment on cardiovascular parameters in conscious rats: baseline: before treatments (n = 10); phentolamine: after treatment with phentolamine (10 mg/kg, i.p., n = 10) alone; atenolol after phentolamine: after atenolol administration (10 mg/kg, i.p., n = 5) following phentolamine treatment; atropine after phentolamine: after atropine administration (10 mg/kg, i.p., n = 5) following phentolamine treatment. HR and SBP data are presented as box (median ± interquartile range) and whisker (5 and 95 percentile values) plots, and SBPV data are presented as mean ± SEM. Averaged 20-min data were used as baseline data; data of treatment with autonomic blockers were averaged from 20-min data recorded during the 10–30 min after each injection. *p < 0.05, **p < 0.01 and ***p < 0.001 compared with baseline (paired t test); †p < 0.05, ††p < 0.01 and †††p < 0.001 when compared with first and second treatment [two-way analysis of variance (ANOVA) and Holm’s post hoc test]
