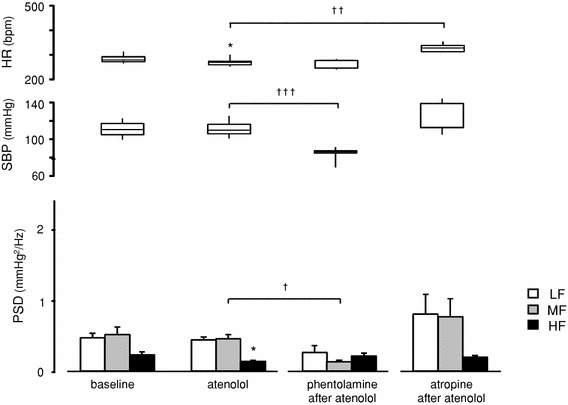
Fig. 4.

Effects of subsequent administration of phentolamine or atropine after atenolol treatment on cardiovascular parameters in conscious rats: baseline: before treatments (n = 10); atenolol: after treatment with atenolol (10 mg/kg, i.p., n = 10) alone; phentolamine after atenolol: after phentolamine administration (10 mg/kg, i.p., n = 5) following atenolol treatment; atropine after atenolol: after atropine administration (10 mg/kg, i.p., n = 5) following atenolol treatment. HR, SBP, and SBPV data are presented as in Fig. 3. In this figure, 20-min data were employed in the same manner as those used in Fig. 3. *p < 0.05, **p < 0.01 and ***p < 0.001 compared with baseline (paired t test);†p < 0.05, ††p < 0.01 and †††p < 0.001 when compared with first and second treatment [two-way analysis of variance (ANOVA) and Holm’s post hoc test]
