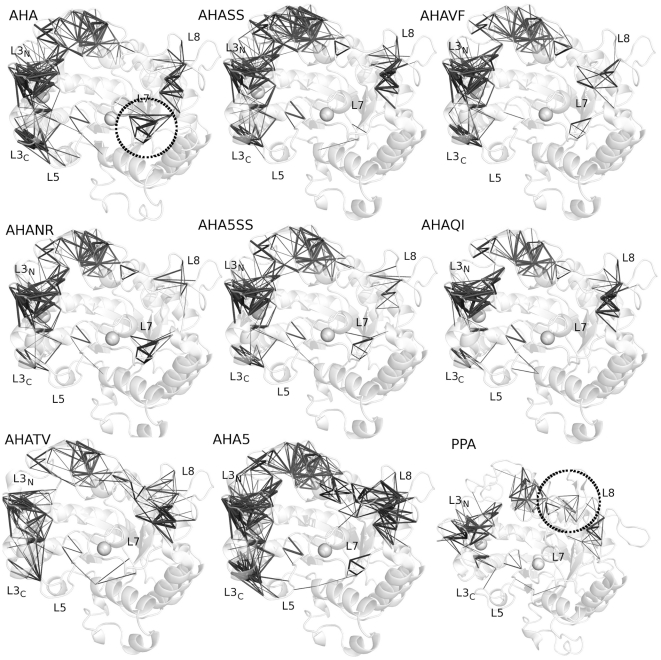
Figure 5. Significant positive correlations between Cα atoms of domains A and B.
The positive correlations are represented as grey sticks connecting the Cα atoms of the average structures from simulations. Grey spheres represent the coordinated ions. The regions of loop 7 and 8 are highlighted by circles in AHA and PPA, respectively.

