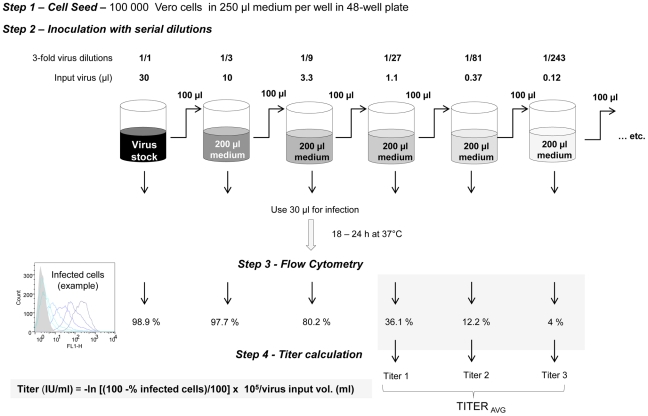
Figure 2. Experimental scheme and data analysis for virus titration based on flow cytometry numbering of infected cells – “Protocol at a glance”.
Top panel from right to left, 3-fold dilution of unknown virus sample. Middle panel, example of histogram profiles of infected cells according to the virus inoculum size. Bottom panel: % of infected cells as graphically determined and equation used to calculate the titer for each inoculum volume. Underlined in grey, selected values for titer determination by averaging.

