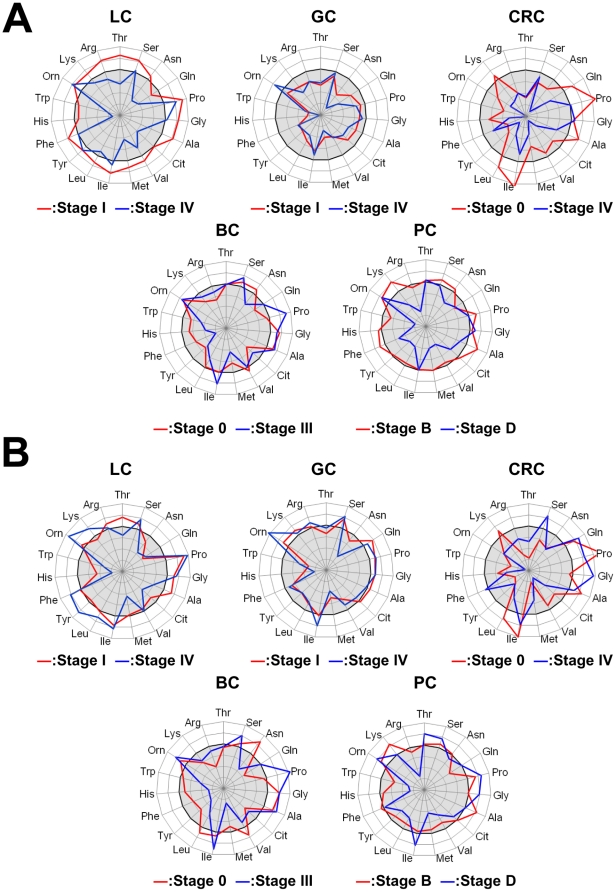
Figure 3. PFAA profiles of early- and advanced-stage cancer patients.
The axes show the AUC of ROC for each amino acid for discriminating patients from controls. A. Comparison of concentrations of cancer patients and controls. B. Comparison of ratios of cancer patients and controls. Scale as described for Figure 2. For LC, GC, CRC, and BC, cancer stages were determined according to the International Union Against Cancer TNM Classification of Malignant Tumors, 6th edition [38], and for PC, cancer stages were determined according to Jewett staging system [39].

