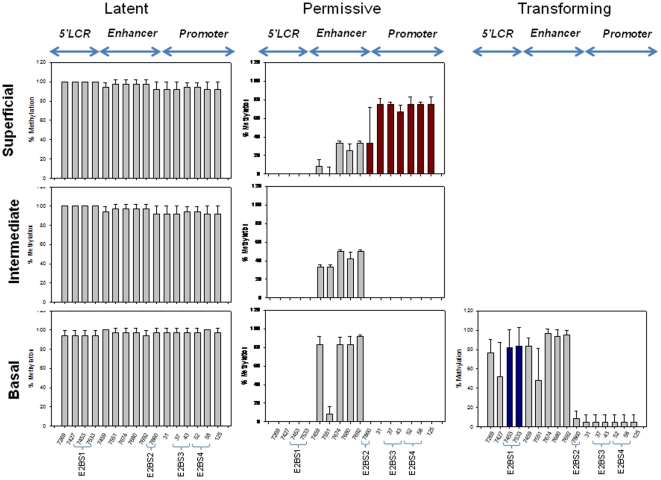
Figure 6. Schematic representation of the relative methylation frequencies of 16 CpG nucleotides within the HPV16 URR.
The degree of methylation of 12 independent clones each isolated from basal, intermediate and superficial cell layers from the three latent, permissive and five transforming parts of the cervical epithelium investigated by genomic sequencing as shown in Figure 3, 4 and 5. The y-axis shows the mean percentage of methylated HPV16 genomes at each of the 16 CpG dinucleotides ± standard deviation (SD). Mean values and SDs (three independent lesions per each CpG) were calculated from Sigma Plot 10.0. Nucleotide numbers refer to those of the HPV16 reference clone (GenBank NC_001526).

