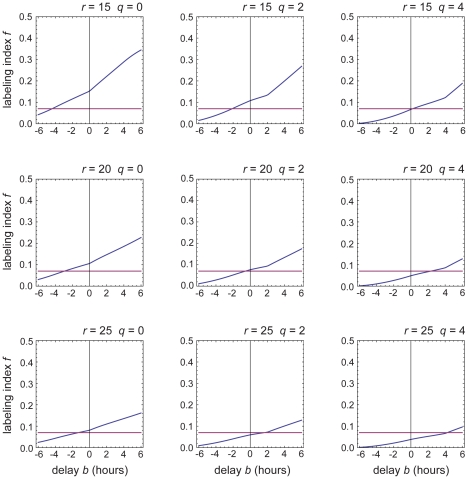
Figure 6. Onset of Dll1 expression and onset of the block to cell cycling must be coincident within ±4 hours.
The graphs show the predicted S-phase labeling index (blue curve) for cells that have switched on Dll1 (as indicated by the β-galactosidase reporter) as a function of the delay b between this event and onset of the cell-cycle block. Results are shown for each of a range of possible values of the cells' average crypt residence time r (taken to be somewhere between 15 and 25 hours [34]) and of the timing q of Start in the cell cycle (taken to lie somewhere between the beginning of G1 phase (q = 0) and the beginning of S phase (q = 4 hours [34])). The horizontal purple line marks the measured value of the labeling index for cells expressing the Dll1 reporter. From the point of intersection of the line and the curve, we can read off the value of the delay that must be postulated to explain the observed labeling index on the assumption of the specified values of r and q. No matter what values we assume for r and q within these plausible ranges, we see that the delay b cannot be more than ±4 hours. See Text S1 for full details.

