
Figure 4.
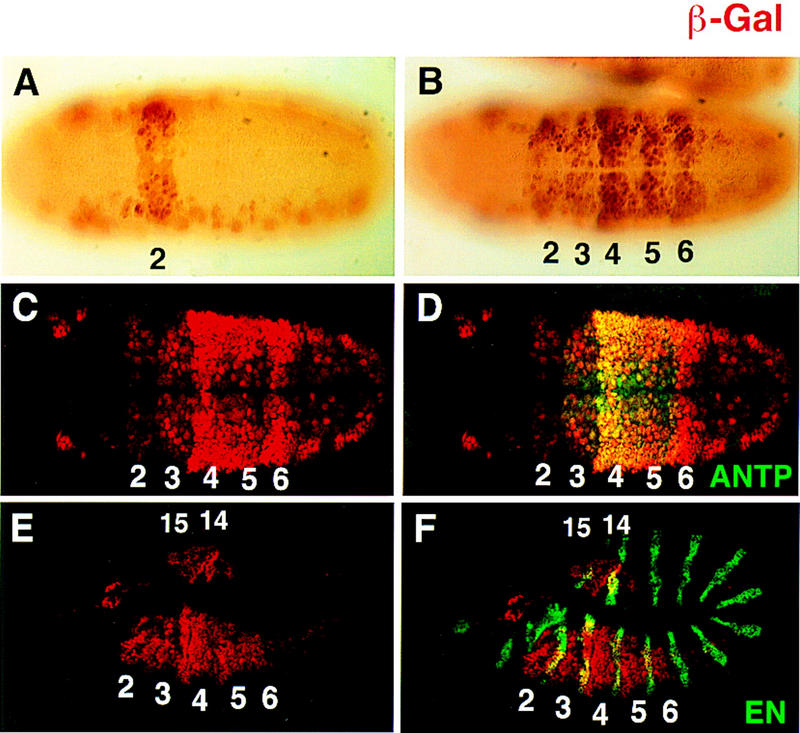
Different expression patterns dictated by fkh[250]–lacZ and fkh[250con]–lacZ in vivo. (A,B) Histochemically stained fkh[250]–lacZ (A) and fkh[250con]–lacZ (B) embryos stained for β-gal (brown). Expression of the fkh[250]–lacZ element is confined to PS 2 (A) and expression of fkh[250con]–lacZ is observed from PS 2 through PS 6 (B). (C–F) Fluorescent double labeling of fkh[250con]–lacZ embyros for β-gal (red) and Antp (green) (C,D), or En (green) (E,F) localizes the fkh[250con]–lacZ expression domain from PS 2 to PS 6. Expression of fkh[250con]–lacZ in PS 14 and PS 15 can be seen in (E and F).