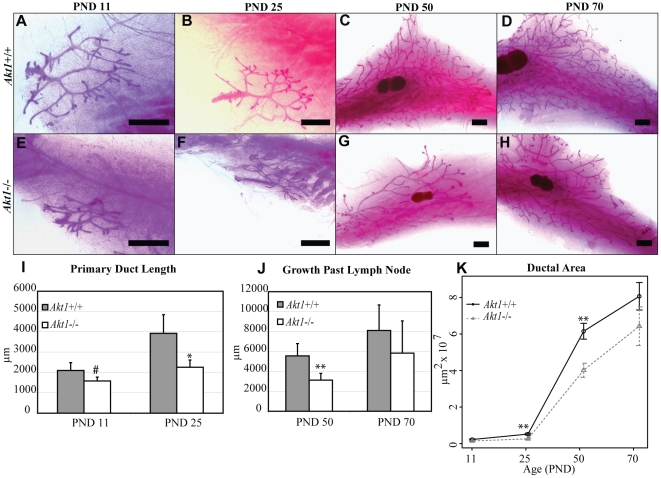
Figure 1. Akt1 promotes postnatal mammary gland growth.
Representative whole mounts of Akt1+/+ (A–D) and Akt1−/− (E–H) mammary glands at PND 11 (A,E), PND 25 (B,F), PND 50 (C,G), and PND 70 (D,H). Measurement of primary duct length at PND 11 and PND 25 in Akt1+/+ and Akt1−/− glands (I). Measurement of the growth past the lymph node at PND 50 and PND 70 in Akt1+/+ and Akt1−/− glands (J). Quantification of ductal outgrowth for Akt1+/+ and Akt1−/− mammary glands at PND 11, 25, 50, and 70 (K). Data represented in line plot as mean +/− standard error. Data represented in bar plots as mean + standard error. Scale bars indicate 1,000 µm. Statistical analyses were conducted using a two-tailed student's t test. **p<0.01, *p<0.05. n = 3–8 per genotype, per age group.

