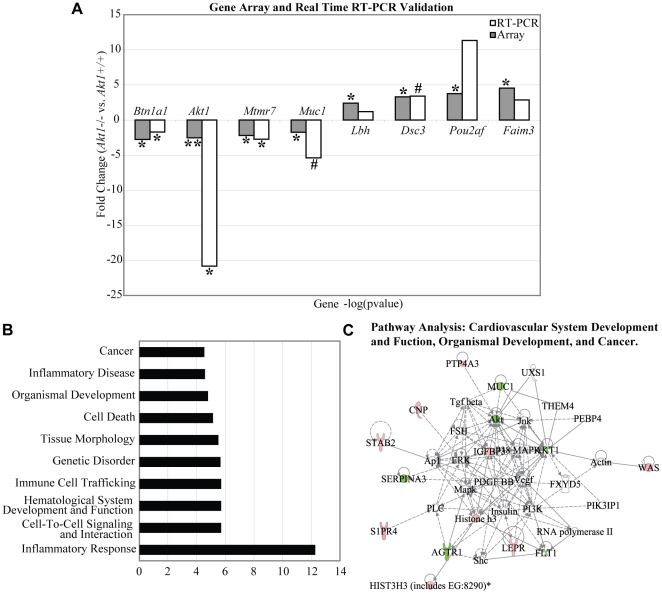
Figure 3. Akt1 influences gene expression patterns in the adult mammary gland.
Microarray results were validated with qRT-PCR for the genes Btn1a, Akt1, Mtmr7, Muc1, Lbh, Dsc3, Pou2af, and Faim3. Data represented as fold change in gene expression for Akt1−/− vs. Akt1+/+ (A). IPA analysis generated the top ten biological functions and diseases altered by the loss of Akt1 (B) IPA analysis generated an association network connecting cardiovascular system development and function, organismal development, and cancer (C). Statistical analyses for qRT-PCR were conducted using a two-tailed student's t test. **p<0.01, *p<0.05, #p<0.1. n = 3 per genotype for microarray, n = 6 per genotype for qRT-PCR.

