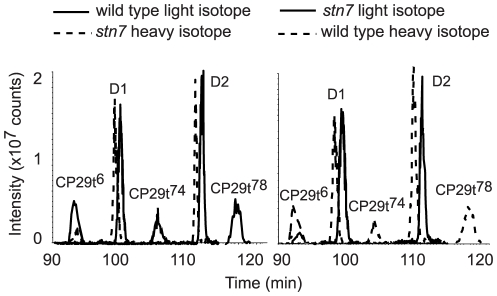
Figure 3. Comparative analysis of CP29 phosphorylation in the high light treated wild type and stn7 mutant plants using stable isotope labeling and LC-MS.
Extracted ion chromatograms of the phosphorylated peptides from CP29, with the superscript numbers indicating phosphorylated threonine residue according to Table 1, and from D1 and D2 proteins, as marked. The left chromatogram shows intensities of phosphorylated peptide signals from the wild type labeled with light isotope (solid line) and from stn7 labeled with heavy isotope (dashed line). The right chromatogram shows the results of reciprocal labeling: the wild type labeled with heavy isotope (dashed line) and stn7 labeled with light isotope (solid line). There was no significant difference in the retention times of the labeled peptides and the dashed lines are shifted to the left from the solid lines artificially to allow clear comparison of the peak intensities.

