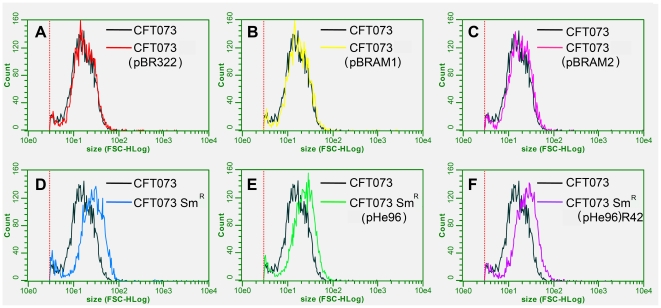
Figure 1. Cell size measured by flow cytometry for the strains of the two isogenic systems.
Each graphic compares size measurement for bacterial cell populations consisting of the reference susceptible strain E. coli CFT073 (in black) and of the tested strain : E. coli CFT073(pBR322) (qnr-negative) in red (part A), E. coli CFT073(pBRAM1) (qnrA3-positive) in yellow (part B), E. coli CFT073(pBRAM2) (qnrA3-positive) in pink (part C), E. coli CFT073-SmR (qnr-negative) in blue (part D), E. coli CFT073-SmR(pHe96) (qnrA3-positive) in green (part E) and its variant R42 in purple (part F). Measurements were made separately, not in a competitive assay.

