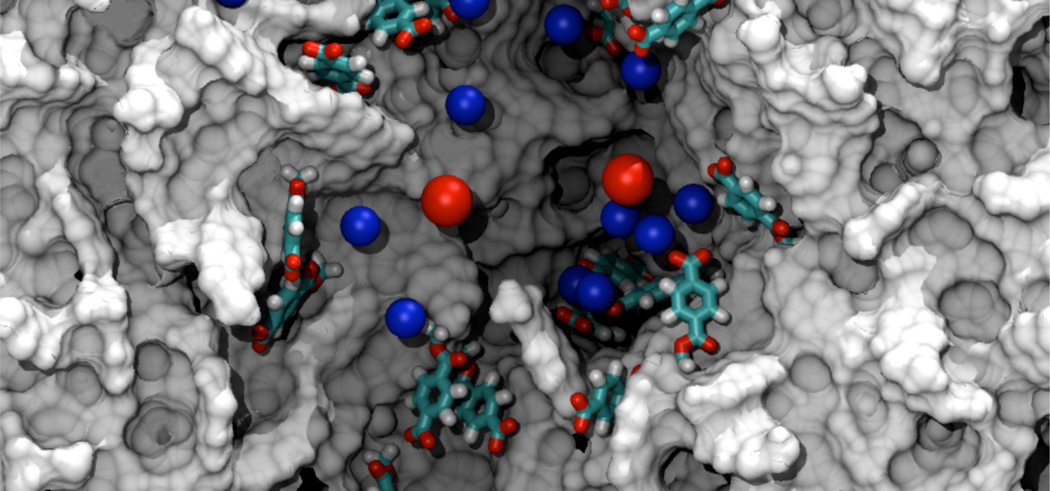
Fig. 6.
Molecular dynamics simulation of PET nanopores. The figure shows a PET nanopore of a 1.5 nm radius. The nanopore is cut in the middle to reveal the interior of the pore. The gray surface shows the carbon-based structure of the nanopore. Deprotonated benzoic groups at the surface of the nanopore are shown in licorice representation. Blue and red spheres represent K+ and Cl− ions, respectively. Water molecules are not shown.

