
Figure 8.
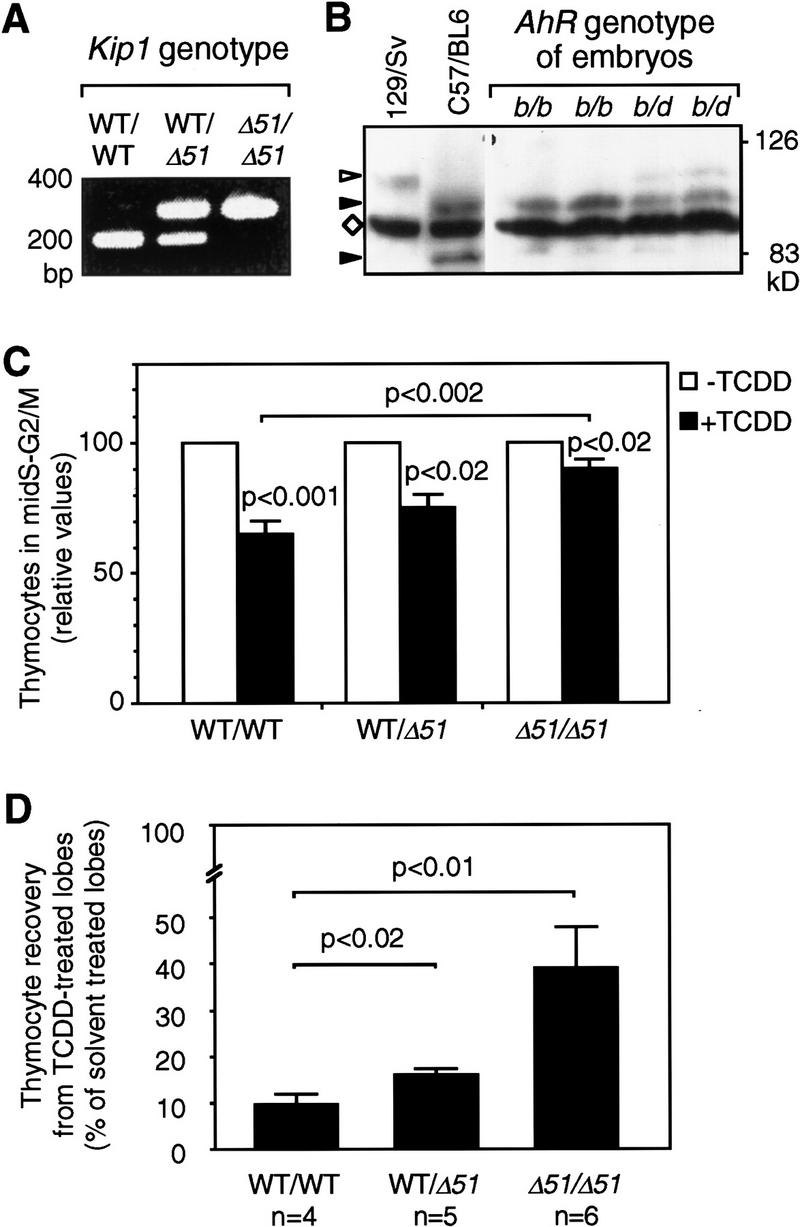
FTOC from wild-type or Kip1 mutant mice. FTOCs were prepared from wild-type (WT), Kip1 mutant (Δ51/Δ51), or heterozygous littermate embryos. A representative PCR-based genotyping for Kip1 is shown in A. Genotyping for AhR alleles (B) was performed by Western blot analysis of the encoded proteins. Liver cytosolic extracts from C57/Bl6 (AhRb1 allele) and 129/Sv (AhRdallele) mice were loaded as reference together with extracts from AhRb/b or AhRb/d embryos. (Solid arrowhead) The size of AhRb1 (95 kD) and a putative degradation product (82 kD) that is specific for the C57Bl6 mouse; (open arrowhead) AhRd; (⋄) a prominent unspecific band. (C) The effect of TCDD on cell cycle distribution depending on the Kip1 genotype in FTOCs from embryos that carry at least one allele coding for a high-affinity AhR (b1 allele). The fraction of cells in mid-S–G2/M in each of the solvent-treated control thymic lobes was set to 100% and the pair-matched TCDD-treated lobe was evaluated relative to that. Data from six litters were grouped according to genotyping of the embryos (Means ± s.e.: nWT = 10; nKip1 WT/Δ51 = 4; nKip1 Δ51/Δ51 = 5). (Solid bars) +TCDD; (open bars) −TCDD. TCDD effects in each group and differences between groups were statistically evaluated by Student’s t-test. (D) Thymocyte recovery after 7 days of FTOCs in the absence or presence of TCDD was determined by hemocytometer counting. For each pair of thymic lobes isolated from an individual embryo the cell number recovered from the solvent (0.1% DMSO) treated lobe was set to 100% and the recovery from the TCDD-treated lobe (1 nm) was calculated as relative value. Data from three litters were grouped according to Kip1 genotyping and confirmation of the presence of at least one high-affinity AhR allele. Values are means ± s.e. (nwt = 4, nhet = 5, nKip1 Δ51/Δ51 = 6) and significance levels were calculated by Student’s t-test.