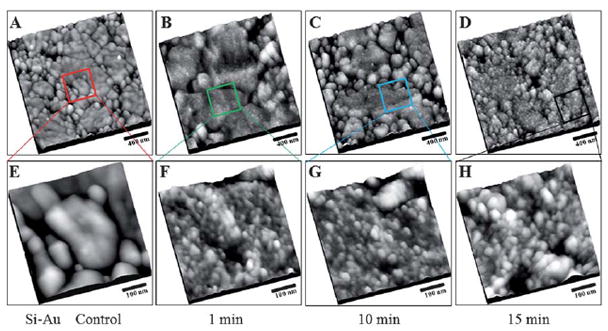
Fig. 4.

Tapping mode-AFM topographs of the NHS functionalized rough gold surface after adsorption of bovine serum albumin. (A) 2000 nm × 2000 nm, NHS treated rough gold surface without exposure to BSA. Similarly, 2000 nm × 2000 nm, AFM topographic images of NHS active esters rough gold surface after exposure to 1.0 μg ml−1 BSA, for (B) 1 min, (C) 10 min, and (D) 15 min. (E–H) Higher resolution, AFM topographic images, 500 nm × 500 nm, of the areas indicated by the boxes in (A–D), respectively. The sample was thoroughly rinsed with 1% Tween 20, and Milli-Q water, before images were acquired using AFM.
