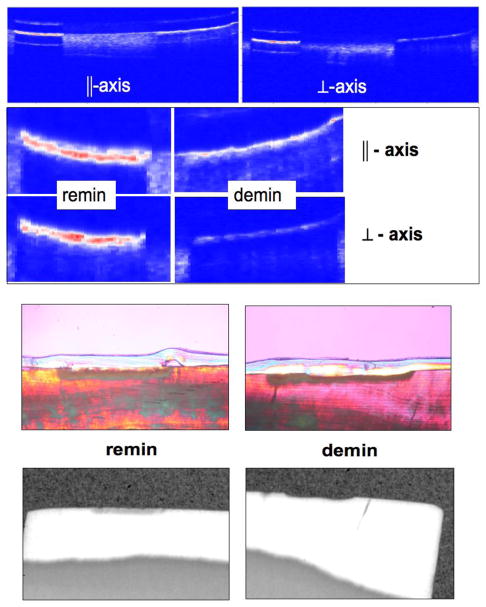
Fig. 2.
PS-OCT b-scans of one sample for both polarizations with demin + remin area on the left side and the demin only area is on the right. The entire scans are should at the very top and the magnified areas are shown just below as indicated. The transparent material visible in the PLM images is cyanoacrylate adhesive. The corresponding PLM and TMR images are shown on the bottom for each area (note they are not of the same scale).

