Fig. 4.

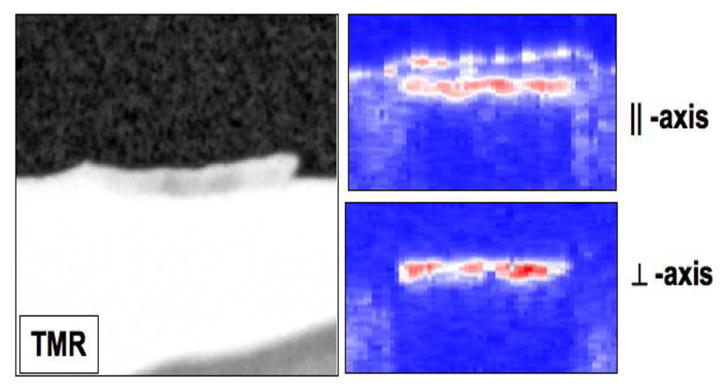
PS-OCT scan of the remin area on one sample with a transparent, high mineral density a “remin” surface zone protruding above the surface. The TMR image is on the two PS-OCT scans at both polarizations are on the right.

PS-OCT scan of the remin area on one sample with a transparent, high mineral density a “remin” surface zone protruding above the surface. The TMR image is on the two PS-OCT scans at both polarizations are on the right.